Identifying regional wall motion abnormalities on ultrasound

regional wall motion abnormalities

Background

Traditionally, the focus of emergency point-of-care echocardiography has been threefold: to assess left ventricular systolic function, to identify the presence of right ventricular enlargement and to evaluate for pericardial effusion. Assessing for regional wall motion abnormalities has been left to formal echocardiography and Cardiology (1). However, structural abnormalities can appear within seconds from the onset of myocardial ischemia (2), so identifying wall motion abnormalities in patients with chest pain or suspected acute coronary syndrome (ACS) in the Emergency Department may be clinically beneficial for emergency providers, leading to more prompt and appropriate diagnostic or therapeutic measures.

We evaluate the following article that looks at whether ED physicians can accurately identify regional wall motion abnormalities.

WAMAMI: emergency physicians can accurately identify wall motion abnormalities in acute myocardial infarction


Clinical Question

Can emergency physicians with basic training in emergency echocardiography accurately identify regional wall motion abnormalities (RWMA) in patients admitted with STEMI?

Methods & Study Design

• Design 

Observational report – one group of residents trained and tested in an ultrasound procedure.

• Population 

75 patients admitted with STEMI. 6 were excluded from the analysis due to withdrawal, leaving AMA or inability to obtain interpretable images.

• Intervention 

Nine residents viewed 2 video instructional modules to provide an introduction to identifying RWMA, and completed an online test evaluating echocardiographic clips for RWMA. They then performed a bedside echocardiogram on patients with known STEMI, though they were blinded to any clinical data about the patient, including the EKG. This was performed within 24 hours of the formal comprehensive echocardiogram.

• Outcomes  

The primary outcome was agreement between resident performed echo and formal comprehensive echo on the presence and localization of RWMA. 

Results

62% of subjects enrolled had a wall motion abnormality identified by the reference standard. Study investigators identified the presence of RWMA with good sensitivity and specificity (Table 2).


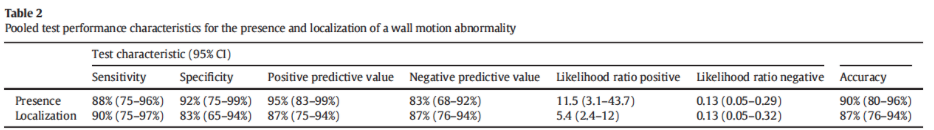
Inter-rater agreement between the point-of-care echocardiogram and the formal echocardiogram for the presence of RWMA was K = 0.79 (95% CI: 0.64–0.94).


Strength & Limitations

Strengths:

Promising results suggest that emergency medicine physicians can be taught to accurately identify RWMA in STEMI with little training. Though the patients in this study were already known to have STEMI on EKG, the application of this procedure may be helpful when patients arrive with NSTEMI or elevated cardiac markers to help in the clinical decision making.

Limitations:

Study was conducted using just 9 residents, and 2 of the residents did the vast majority of the scans. It is possible that these residents are already skilled in ultrasound, so to truly gauge whether this method is broadly teachable, many more residents (with varying levels of baseline ultrasound experience) would need to be evaluated.

Authors Conclusion

The ability to diagnose a RWMA offers emergency clinicians another tool to help manage patients with chest pain and suspected ACS. These data support the introduction of focused training in RWMA identification and expansion of the clinical use of emergency and critical care echocardiography.

Our Conclusion

This is an interesting concept that emergency medicine residents can be trained to successfully identify RWMA using echocardiography. If, and how, this should be implemented in clinical practice is still yet to be explored. Perhaps this could be used in cases of NSTEMI or elevated cardiac markers to help inform clinical decision making, but this study does not answer the question of whether this skill will be clinically useful for ED physicians. 

The Bottom Line 

It is possible to train emergency medicine physicians to identify regional wall motion abnormalities using echocardiography.

Authors

This post was written by Allison Auchter, MS4 at UCSD School of Medicine, Charles Murchison, MD and Amir Aminlari, MD. 

References

P.E. Croft, T.D. Strout, R.M. Kring, et al., WAMAMI: emergency physicians can accurately identify wall motion abnormalities in acute myocardial infarction, American Journal of Emergency Medicine.


    1. Cheitlin MD, Armstrong WF, Aurigemma GP, et al. ACC/AHA/ASE 2003 guideline update for the clinical application of echocardiography: summary article: a report of the American College of Cardiology/American Heart Association Task Force on Practice Guidelines (ACC/AHA/ASE Committee to Update the 1997 Guidelines of the Clinical Application of Echocardiography). Circulation 2003;108(9):1146–62.

    2. Wholgelernter D, Cleman M, Highman HA, et al. Regional myocardial dysfunction during coronary angioplasty: evaluation by two-dimensional echocardiography and 12 lead electrocardiography. J Am Coll Cardiol 1986;7(6):1245.

Can ED physicians use TAPSE to rule out PE?

tapse ultrasound

Background

Pulmonary embolism (PE) often makes it on the differential of emergency department (ED) patients with any sort of cardiac or pulmonary complaint, and it can be a diagnostic challenge to know how far into the work up of PE is necessary for each patient. Any bedside tool that can increase or decrease the likelihood ratio for PE could be beneficial. Bedside echocardiography is one of the key tools in an ED physicians belt to narrow down differentials or potentially rule out certain diseases.

Research shows that 30 to 70% of emergency department patients with a PE will exhibit signs of right ventricular dysfunction (RVD), and a focused transthoracic cardiac ultrasound (FOCUS) is effective at detecting RVD (1). However, common measures of RVD, such as right heart enlargement, can be challenging to assess and often are dependent on the operator (2,3). A different measure, tricuspid annular plane systolic excursion (TAPSE), has been shown to accurately detect RVD while also providing prognostic information and is the least user dependent measure (4-9).

To date, there is little research on the utility of TAPSE in diagnosing PE, this study aimed to assess the diagnostic characteristics of TAPSE for PE and to optimize the measurement cutoff of TAPSE in diagnosing a PE.


Emergency physician performed tricuspid annular plane systolic excursion in the evaluation of suspected pulmonary embolism


Clinical Question

    • How accurate is TAPSE in diagnosing a PE?
    • What is the optimal measurement cutoff of TAPSE in diagnosing a PE ?
    • How good is the inter-rater reliability of TAPSE
    • How good are physicians at visually estimating TAPSE?

Methods & Study Design

• Design 

Prospective, observational convenience sample of FOCUS in ED patients undergoing evaluation for suspected PE from April 2015 to April 2016.

• Population 

Subjects were eligible if they were 18 years or older and undergoing computed tomographic angiography (CTA) for evaluation of possible PE in the ED. Prisoners, wards of the state, and non–English-speaking patients were excluded.

• Intervention 

Patients underwent a FOCUS in the ED either prior to undergoing CTA or the operator was blinded to the results if the FOCUS was done after the CTA. The operators were ultrasound trained emergency physicians, fellow,  or residents with one medical student participating who was trained in measuring TAPSE.

• Outcomes  

The primary outcome was both describing the diagnostic test characteristics of TAPSE in diagnosing PE and optimizing the measurement cutoff of TAPSE in diagnosing a PE. The secondary outcomes were assessing inter-rater reliability, quantitative visual estimate of TAPSE, and to describe the diagnostic test characteristics of other measures of RVD.

Results

The study found that TAPSE was 72% sensitive and 66% specific when the cutoff was 2.0 cm. When using the pre-established TAPSE cut off of 1.7, TAPSE was 56% sensitive and 79% specific.

They noted that in the sub-group of patients who were either tachycardic or hypotensive, TAPSE became 94% specific and the FOCUS was 100% specific.

Additionally, TAPSE had high inter-rater reliability, physicians were able to qualitatively assess TAPSE as normal or abnormal, and the test characteristics of TAPSE were much more sensitive and specific for a PE than other measures on the FOCUS.

Strength & Limitations

Strengths:

This study was well designed for the question it sought to answer and did a good job limiting bias by blinding the participants. They asked clinically relevant questions.

Limitations:

This study was limited in that it was a convenience sample of patients making it susceptible to selection bias. Additionally, the ultrasound operators in this study had extensive ultrasound training and TAPSE training, thus it may not be generalizable to the standard population of emergency physicians.

Authors Conclusion

"The optimal cutoff for diagnosis of PE using TAPSE was determined to be 2.0 cm. The diagnostic test characteristics of TAPSE for PE are comparable to other measures of RVD, although TAPSE appears to be somewhat more sensitive and less specific. The incorporation of TAPSE into the evaluation of the right heart may increase the accuracy and reliability of beside echocardiography for the detection of PE, although our data suggest that FOCUS is of limited utility in all patients presenting with concern for PE.

However, FOCUS and TAPSE appear to be highly sensitive for PE in patients with tachycardia or hypotension. Additionally, emergency physicians with advanced training in emergency ultrasound are capable of measuring TAPSE with precision comparable to that reported in the cardiology literature. Emergency physicians are able to accurately visually estimate TAPSE as either normal or abnormal, based on an a prior cutoff of 1.7 cm. As a more reliable measure of RVD, TAPSE may also help EPs to determine the severity and prognosis of a patient diagnosed as having a PE."

Our Conclusion

TAPSE is only a moderately sensitive and specific test in diagnosing a PE. However, TAPSE can be a useful tool in patients who are hemodynamically unstable with a suspected PE. In this case, the sensitivity of TAPSE in diagnosing a PE increases dramatically and in the setting of a hemodynamically unstable patient with a normal TAPSE, PE is unlikely the etiology. This can be beneficial if a patient is too unstable to go for a CTA, to help with diagnostic clarification and decision making.

The Bottom Line 

TAPSE is not sensitive or specific enough to rule in or rule out PE, but the sensitivity dramatically improves in hemodynamically unstable patients. TAPSE has high inter-rater reliability.

Authors

This post was written by Allie Frankel, MS4 at UCSD School of Medicine, Charles Murchison, MD and Amir Aminlari, MD. 

References

Daley J, Grotberg J, Pare J, Medoro A, Liu R, Hall MK, Taylor A, Moore CL. Emergency physician performed tricuspid annular plane systolic excursion in the evaluation of suspected pulmonary embolism. Am J Emerg Med. 2017 Jan;35(1):106-111. doi: 10.1016/j.ajem.2016.10.018. Epub 2016 Oct 11. PMID: 27793505.


    1. Matthews JC, Mclaughlin V. Acute Right Ventricular Failure in the Setting of Acute Pulmonary Embolism or Chronic Pulmonary Hypertension: A Detailed Review of the Pathophysiology, Diagnosis, and Management. Curr Cardiol Rev 2008;4:49–59.

    2. Pruszczyk P, Goliszek S, Lichodziejewska B, Kostrubiec M, Kurnicka K, Dzikowska- Diduch O, et al. Prognostic value of echocardiography in normotensive patients with acute pulmonary embolism. JACC Cardiovasc Imaging 2014;7(6):553–60.

    3. Zanobetti M, Converti C, Conti A, Viviani G, Guerriniti E, Boni V, et al. Prognostic Value of Emergency Physician Performed Echcardiography in Patients with Acute Pulmonary Embolism. West J Emerg Med 2013;14(5):509–17.

    4. Kline JA, Steuerwald MT, Marchick MR, Hernandez-Nino J, Rose GA. Prospective evaluation of right ventricular function and functional status 6 months after acute submassive pulmonary embolism: frequency of persistent or subsequent elevation in estimated pulmonary artery pressure. Chest 2009;136(5):1202–10.

    5. Jackson RE, Rudoni RR, Hauser AM, Pascual RG, Hussey ME. Prospective evaluation of two-dimensional transthoracic echocardiography in emergency department pa- tients with suspected pulmonary embolism. Acad Emerg Med 2000;7(9):994–8.

    6. Rudoni RR, Jackson RE, Godfrey GW, Bonfiglio AX, Hussey ME, Hauser AM. Use of Two-Dimensional Echocardiography for the Diagnosis of Pulmonary Embolus. J Emerg Med 1998;16(1):5–8.

    7. Bova C, Greco F, Misuraca G, Serafini O, Crocco F, Greco A, et al. Diagnostic utility of echocardiography in patients with suspected pulmonary embolism. Am J Emerg Med 2003;21(3):180–3.

    8. Kopecna D, Briongos S, Castillo H, Moreno C, Recio M, Navas P, et al. Interobserver reliability of echocardiography for prognostication of normotensive patients with pulmonary embolism. Cardiovasc Ultrasound 2014;12:29–38.

    9. Taylor RA, Moore CL. Accuracy of emergency physician-performed limited echocar- diography for right ventricular strain. Am J Emerg Med 2014;32(4):371–4. 

How accurate is EPSS in estimating ejection fraction?

epss echo

Background

Bedside echocardiography has an established role in the time-sensitive assessment for pericardial effusion, relative chamber size, and global cardiac function of emergency department (ED) patients. Most ED physicians use visual estimation to gauge left ventricular ejection fraction (LVEF), a method that may be subject to inter-observer variability and inaccuracy (1). E-point septal separation (EPSS), the minimum separation between the anterior mitral valve leaflet and the interventricular septum, may offer a more objective measure of LVEF.

epss echo

EPSS was first studied in the 1970s as a quantitative, easily measured, and reproducible index of left ventricular function (2). In healthy individuals, the mitral valve leaflet reaches its maximum excursion near or at the septum during early diastole. EPSS increases as left ventricular ejection fraction (LVEF) decreases, and an EPSS of greater than 7mm predicts poor LVEF (3,4).

The gold standard for evaluating LVEF is a quantitative, calculated value obtained from comprehensive transthoracic echocardiography, which is impractical in the emergency department, thus EPSS offers a simple to learn and easy to obtain alternative, requiring only one view in the parasternal long axis. EPSS measurement is a technique feasible for the ED physician to perform at the bedside that can provide a convenient and reliable estimate of LVEF. 


E-point septal separation: a bedside tool for emergency physician assessment of left ventricular ejection fraction

Clinical Question

Does EPSS measurements obtained by ED physicians correlate with calculated LVEF from comprehensive transthoracic echocardiography (TTE)?

Can certain EPSS cutoff values be used to predict systolic dysfunction? 

What is the relationship between bedside visual estimates of global cardiac function (GCF) and the calculated LVEF measurements?

Methods & Study Design

• Design 

This was a prospective observational trial.

• Population 

A convenience sample of 80 hospitalized patients undergoing comprehensive TTE for any indication. Subjects were recruited between February and April 2012 from an academic level I trauma center. Exclusion criteria were known pregnancy or age less than 18 years.

• Intervention 

Three emergency ultrasound fellows performed bedside 4-view basic echocardiographic examinations consisting of subxiphoid, parasternal long, and parasternal short and apical views and made estimates of GCF. The fellows then obtained separate parasternal long-axis views and performed M-mode measurements of the EPSS. Comprehensive TTE was separately performed by cardiac sonographers and LVEF was calculated via the Teichholz method.

• Outcomes  

    • Subjective estimates of GCF categorized as normal systolic function (LVEF > 55%), moderate systolic dysfunction (30% > LVEF > 55%), or severe systolic dysfunction (LVEF < 30%)
    • EPSS measurements
    • Calculated LVEFs also categorized as normal/moderate/severe as above

Results

Calculated LVEF ranged from 13%-86%. EPSS ranged from 0.50-29.70 mm.

Men had higher EPSS scores and higher calculated estimates of LVEF. No other demographic or clinical variables were identified as potential covariates. 

The linear regression model revealed that EPSS is a statistically significant predictor (P < .001) of calculated LVEF.

An EPSS measurement of greater than 7 mm was 100% sensitive and 51.6% specific for severely reduced LVEF. An EPSS measurement of greater than 8 mm was 83.3% sensitive and 50.0% specific for any systolic dysfunction.

Estimated GCF and calculated LVEF were in agreement in 49 (69.0%) of subjects with a weighted Cohen κ of 0.58, with strongest agreement for subjects with severe systolic dysfunction.

epss echo

Strength & Limitations

Strengths:

This study is the first to demonstrate that EPSS can provide a quantitative prediction of LVEF. One strength of this study is the generalizability of the findings given that all indications for TTE were included. Another strength is that the ED ultrasound fellows and cardiac sonographers performed their studies independently, unlike a prior study that utilized the same scans performed by residents to obtain both EPSS and LVEF. 

Limitations:

There were possible misestimations of EPSS in certain pathologic states, such as overestimation of EPSS in mitral stenosis. Additionally, this paper describes the Teichholz method, which is subject to inaccuracies, especially in states of dyskinesis. Of note, the Teichholz method has since been supplanted by the modified Simpson’s rule and is no longer used clinically. On average, time from EPSS measurement to comprehensive echocardiogram was 6 hours with the possibility that systolic function changed during that window of time. Finally, the study size was fairly small with 71 subjects included in the final analysis.

Authors Conclusion

ED physicians can assess left ventricular systolic function using the EPSS, and EPSS is strongly correlated with calculated LVEF. An EPSS greater than 7 mm may be used to predict patients with severely reduced LVEF. ED physician visual estimation was less effective and less consistent than EPSS measurement for predicting systolic function.

Our Conclusion

We agree that EPSS is a feasible and useful tool for assessing systolic function at the bedside. This study establishes that a 7 mm EPSS cutoff is highly sensitive for detecting severe systolic dysfunction. The clinical utility of an EPSS cutoff of 8 mm for any systolic dysfunction is less clear. Employing EPSS measurement with the 7 mm cutoff in mind, in conjunction with visual estimation by an experienced ED sonographer, is likely to provide a more complete picture of a patient’s systolic function at the bedside prior to obtaining a formal echocardiogram.

The Bottom Line 

EPSS measured on bedside ultrasound the ED is an easily obtainable, quantitative predictor of systolic dysfunction. A cutoff of 7mm is sensitive in identifying systolic dysfunction.

Authors

This post was written by Jennie Xu, MS4 at UCSD School of Medicine, Charles Murchison, MD and Amir Aminlari, MD. 

References

McKaigney CJ, Krantz MJ, La Rocque CL, Hurst ND, Buchanan MS, Kendall JL. E-point septal separation: a bedside tool for emergency physician assessment of left ventricular ejection fraction. The American Journal of Emergency Medicine. 2014 Jun 1;32(6):493-7.


    1. Labovitz AJ, Noble VE, Bierig M, Goldstein SA, Jones R, Kort S, Porter TR, Spencer KT, Tayal VS, Wei K. Focused cardiac ultrasound in the emergent setting: a consensus statement of the American Society of Echocardiography and American College of Emergency Physicians. Journal of the American Society of Echocardiography. 2010 Dec 1;23(12):1225-30.
    2.  Massie BM, Schiller NB, Ratshin RA, Parmley WW. Mitral-septal separation: new echocardiographic index of left ventricular function. The American journal of cardiology. 1977 Jun 1;39(7):1008-16.
    3. Lew W, Henning H, Schelbert H, Karliner JS. Assessment of mitral valve E point-septal separation as an index of left ventricular performance in patients with acute and previous myocardial infarction. The American journal of cardiology. 1978 May 1;41(5):836-45.
    4. Massie BM, Schiller NB, Ratshin RA, Parmley WW. Mitral-septal separation: new echocardiographic index of left ventricular function. The American journal of cardiology. 1977 Jun 1;39(7):1008-16.

Case 23: Diastolic Dysfunction

diastolic dysfunction echo


A 79 year old female presented to the emergency room with worsening dyspnea on exertion.  She reported orthopnea, leg swelling, and only being able to walk a few steps without getting short of breath. She denied chest pain, fever, or productive cough, and she had been compliant with her medications. Of note, the patient was seen 3 weeks ago for chest pain, at which point she had a dobutamine stress echo that demonstrated non-reversible ischemic changes. During examination, the providers noted JVD, crackles at bilateral bases, and bilateral lower extremity pitting edema. 


Vitals: T 97.3   BP 152/81   HR 83       RR 18      SPO2 97% on RA


Your initial impression is a slamdunk heart failure exacerbation. However, a bedside ECHO is performed normal ejection fraction. This doesn’t appear to be the classic HFrEF exacerbation you’ve seen countless times before. What do we see in the echo below? What does it tell us about this patient's diastolic function?


diastolic dysfunction echo
e e' echo

Answer and Learning Points

Answer:

The two images above are an apical four chamber view with the doppler gait measuring mitral inflow velocity and tissue doppler, respectively. They show Grade 1 diastolic dysfunction.

Assessing for diastolic dysfunction is best achieved with an apical four chamber view and involves two measurements: mitral inflow and tissue doppler. Mitral inflow velocity is measured by placing pulsed-wave doppler at the mitral valve leaflet tips. During diastole, there are two surges of blood flow through the mitral valve. The first is Early filling immediately after the valve opens (E wave), representing ventricular relaxation. The second wave comes from the Atrial kick (A wave). In normal diastolic function, the E wave should be larger than the A wave because most of the blood enters the ventricle during relaxation, with the atrial kick subsidizing this.

Look at the diagram below to see how the E/A wave changes with the different grades of diastolic dysfunction. In our patient, the A wave was larger than the E wave so we knew this patient had grade 1 diastolic dysfunction, i.e. impaired relaxation. This happens when the stiff ventricle no longer pulls most of the blood in with relaxation (as relaxation is impaired), so the atrial kick does most of the diastolic filling. Our patient was admitted to cardiology for IV diuresis and medical optimization.

For patients whose E wave is larger than their A wave, it can be unclear whether this is a normal, pseudonormal or restrictive pattern. Tissue doppler can help further assess whether this. Place the doppler gate at the mitral valve annulus to assess left ventricular muscle relaxation. As diastolic dysfunction worsens, the ability of the left ventricle to relax will progressively worsen. Looking at the diagram below again, we see that in normal diastolic function the e' wave will be larger than the a', but as the ventricle loses its ability to relax the e' wave will get smaller. If the e' is the same size or smaller than the a' this represents diastolic dysfunction. 

diastolic dysfunction

Learning Points:

  • Heart failure with preserved ejection fraction makes up half of the patients with heart failure.
  • HFpEF can be assessed in the apical four chamber view by evaluating the mitral valve inflow at the leaflet tips and tissue doppler at the annulus.
  • The E wave is blood flow through the mitral valve during early diastole and the A wave is during the atrial kick.
  • In one study, sensitivity and specificity of diagnosing clinically significant diastolic dysfunction was 92% and 69% respectively for emergency physician conducted echocardiography (1).

References

This post was written by Megan Jackson, PGY1 at UCSD Emergency Medicine Residency Program, Charles Murchison, MD and Amir Aminlari MD

Can IVC collapsibility predict fluid responsiveness in non-ventilated patients?

ivc ultrasound

Background

Fluid responsiveness is key in guiding the resuscitation of critically ill patients, and both under and over resuscitation can lead to poor clinical outcomes. Vitals and physical exam are not always reliable in determining fluid responsiveness. The search for a quick, easy and accurate diagnostic test to determine fluid responsiveness is ongoing. IVC collapsibility (cIVC) has been proposed as a helpful measure, and in ventilated patients this measurement has been validated. However, spontaneously breathing patients have different physiology, so it is unclear if cIVC is an accurate predictor of fluid responsiveness in this cohort. Previous studies have recommended a cIVC cutoff of 40-42% as a reliable predictor of fluid responsiveness in spontaneously breathing patients (1,2). This study sought to validate those findings. 


Inferior vena cava collapsibility detects fluid responsiveness among spontaneously breathing critically-ill patients

Clinical Question

Can the collapsibility of the inferior vena cava differentiate between fluid responders and fluid non-responders in non-ventilated critically ill patients?

Methods & Study Design

• Design 

This was a prospective observational trial.

• Population 

Inclusion: spontaneously breathing patients with signs of acute circulatory failure in the ED and ICU of 2 academic hospitals in the US.

Exclusion: primary traumatic, cardiogenic, obstructive, or neurogenic shock; age < 18 years old; incarceration; pregnancy; and/or hospitalization for >36 h; NIPPV; if the clinical team felt that they had active pulmonary edema; or that believed that further IVFs might pose a clinical risk.

• Intervention 

A NICOM device monitored cardiac index at 1 minute intervals for the duration of the study. Patients had initial cardiac index measurements and IVC videos recorded. Then, after a 3 minute passive leg raise, an additional IVC video was recorded. Lastly, patients received a 500ml normal saline bolus and immediately had a final IVC video recorded. Images were reviewed after the study to determine the cIVC.  

• Outcomes  

The primary outcome was fluid responsiveness, defined as a ≥ 10% increase in cardiac index.

Results

A cIVC of 25% provided maximum sensitivity (87%) and specificity (81%) in identifying fluid responders. However, as you can see in the figure below, there were several patients with cIVC below 25% who were fluid responders, and several patients with cIVC above 25% who were not fluid responders. 

IVC fluid responder
Corl et al.

Strength & Limitations

Strengths: The prospective study design reduces bias and confounding factors. Few studies have examined fluid responsiveness in non-ventilated patients, and this adds to the growing body of evidence in this population. 

Limitations: This study primarily included patients with severe sepsis/septic shock and DKA/HHS. This limits the generalizability of the findings to other forms of acute circulatory failure. Furthermore, fluid responsiveness was measured once immediately following the bolus. Monitoring the patients’ clinical status over several hours or for the duration of the ICU admission may have provided additional, clinically relevant data regarding fluid resuscitation.

Authors Conclusion

“cIVC, as measured by POCUS, is able to detect fluid responsiveness and may be used to guide IVF resuscitation among spontaneously breathing critically-ill patients.”

Our Conclusion

In spontaneously breathing patients with distributive shock, cIVC can be a useful tool in identifying fluid responsiveness, with the caveat that a minority of patients with minimal IVC collapsibility may still be fluid responders and those with significant IVC collapsibility may not be fluid responders. There is certainly a trend toward a collapsible IVC identifying fluid responders, but the outliers in this study should be taken into account. IVC, along with history, exam and bedside echo, can be used to identify which patients may need more IV fluid resuscitation. 

The Bottom Line 

IVC collapsibility >25% predicts fluid responsiveness in spontaneously breathing patients with distributive shock most of the time, but should not be solely relied upon.

Authors

This post was written by Aaser Ali, MS4 at UCSD School of Medicine, Charles Murchison, MD and Amir Aminlari, MD. 

References

  1. Corl KA, George NR, Romanoff J, et al. Inferior vena cava collapsibility detects fluid responsiveness among spontaneously breathing critically-ill patients. J Crit Care. 2017;41:130-137.

  2. Machare-Delgado E, Decaro M, Marik PE. Inferior vena cava variation compared to
    pulse contour analysis as predictors of fluid responsiveness: a prospective cohort
    study. Intensive Care Med 2011;26(2):116–24.

  3. Muller L, Bobbia X, Toumi M, et al. Respiratory variations of inferior vena cava diam-
    eter to predict fluid responsiveness in spontaneously breathing patients with acute
    circulatory failure: need for a cautious use. Crit Care 2012;16(5):R188.

Case # 22: Abdominal Aortic Aneurysm

abdominal aortic aneurysm


A 72 year old male with known abdominal aortic aneurysm (5.7 cm s/p fem-tib bypass, L AKA) presents for 3 weeks with diarrhea and mild LLQ pain. No nausea, vomiting, fever, back pain, urinary symptoms, or blood in stool. He has no localizing abdominal exam & no peritoneal signs, strong even radial pulses, and normal cardiopulmonary exam. On further chart review, patient is noted to have a 5+ cm aorta for the past 2 years, with the most recent CT scan a few weeks ago showing growth from 5.5 cm to 5.7 cm. An abdominal ultrasound is performed with the following findings.

Vitals: 

T 98.7 HR 64 BP 167/80 RR 18 O2 100%

What are we concerned about for this patient and why? What is the interpretation of the abdominal ultrasound? What are the next steps for management in the ED?


Courtesy of The Pocus Atlas

Answer and Learning Points

Answer:

The patient’s presenting complaints (diarrhea, mild abdominal pain) do not coincide with the classic triad of ruptured AAA (hypotension, back pain, pulsatile abdominal mass). In addition, this patient is hemodynamically stable and comfortable, which is reassuring. However, ruptured AAA can have a wide variety of presentations and should always be considered in patients with known large AAA. In addition, this patient had a known AAA >5 cm for the past two years with poor vascular surgery follow-up, and the risk for rupture for AAA’s 5.0-5.9cm increases by 5-10% each year. (1)

As this patient recently had a CT scan a few weeks ago revealing large, stable AAA, the decision was made to investigate via ultrasound rather than undergo more radiation from CT. Ultrasound is also highly sensitive and specific for detecting AAA. (2) The above images show the AAA has a large intramural thrombus with no evidence of leaking fluid nor dissection flap. The AAA is stable, measuring a similar width of 5.7 cm. The clinician can investigate further by doing a RUSH exam to reassure against intraperitoneal bleeding and other types of shock. Elective aortic surgery is recommended for patients with AAA >5.5 cm, because at this threshold the risk of rupture is greater than risk of surgery, therefore it is reasonable to consult vascular surgery for this patient in the ED. (1)


Learning Points

  • Ruptured AAA being a surgical emergency and nearly uniformly fatal. Risk of rupture is proportional to size of AAA:AAA rupture risk
  • Elective aortic surgery is the most effective management, however, is not recommended until the aneurysm exceeds 5.5 cm diameter. In the ED setting, it is reasonable to consult vascular surgery for an asymptomatic patient with an incidental finding of aneurysm >5.5 cm. (1)
  • A systematic review of seven studies (n=655) evaluated operating characteristics of emergency department ultrasonography for AAA. With AAA defined as >3cm dilation of aorta, the review showed that ultrasound yielded excellent diagnostic performance. (2)

  • An effective abdominal aortic ultrasound requires:

(1) Evaluation of the entire aorta from the subxiphoid area to the iliac branch bifurcation. Most abdominal aortic aneurysms lie in the infrarenal aorta.

(2) Moving bowel gas out of the way with the probe with either graded compression or curvilinear probe with larger footprint

(3) Careful differentiation aorta from IVC. The aorta will be anterior to the vertebrae and the left of the IVC.

(4) Measuring outer to outer wall. Clot can create can second inner wall and falsely decrease aortic width measurement.

References

(1) Abdominal Aortic Aneurysms (AAA) - Cardiovascular Disorders. Merck Manuals Professional Edition. Accessed July 9, 2020. https://www.merckmanuals.com/professional/cardiovascular-disorders/diseases-of-the-aorta-and-its-branches/abdominal-aortic-aneurysms-aaa

(2) Rubano E, Mehta N, Caputo W, Paladino L, Sinert R. Systematic review: emergency department bedside ultrasonography for diagnosing suspected abdominal aortic aneurysm. Acad Emerg Med. 2013;20(2):128-138. doi:10.1111/acem.12080

(3) Michelle H-B. Tips and Tricks: Big Red - The Aorta and How to Improve Your Image. ACEP Emergency Ultrasound. Accessed July 9, 2020. https://www.acep.org/how-we-serve/sections/emergency-ultrasound/news/february-2016/tips-and-tricks-big-red---the-aorta-and-how-to-improve-your-image/

This post was written by Caresse Vuong, MS4, Charles Murchison, MD and Amir Aminlari MD

Caudal Edge of the Liver in the Right Upper Quadrant (RUQ) View Is the Most Sensitive Area for Free Fluid on the FAST Exam

ruq free fluid

Background

The FAST exam is a useful tool in screening for the presence of intraperitoneal free fluid in the setting of trauma. The utilization of ultrasound provides rapid imaging in the trauma bay that can help guide clinical decision making and the necessity for surgical intervention. The FAST exam is comprised of subxiphoid, right upper quadrant, left upper quadrant, and suprapubic views by ultrasound. Previous research has indicated that the RUQ, specifically the hepato-renal space (Morrison’s pouch), is the preferred area for the detection of free fluid.1,2 However, scarce research into the sub-divisions of each view has been performed.

Caudal Edge of the Liver in the Right Upper Quadrant (RUQ) View Is the Most Sensitive Area for Free Fluid on the FAST Exam

Clinical Question

The aim of this study was to determine what specific sub-divided areas of each FAST view were the most sensitive in the detection of intraperitoneal free fluid. 

Methods & Study Design

• Design 

This was a retrospective cohort analysis. 

• Population 

All patients who received a FAST exam at a single Level 1 trauma center over an 18-month period.

• Intervention 

The RUQ, LUQ, and suprapubic views of the FAST were each subdivided into three additional sections for analysis. Specifically, the RUQ was divided into the hepato-diaphragmatic space (RUQ1), hepato-renal space (Morrison’s pouch) (RUQ2), and the caudal liver tip (RUQ3). The LUQ was divided into the spleno-diaphragmatic space (LUQ1), the spleno-renal space (LUQ2), and the inferior pole of the kidney (LUQ3). The suprapubic area was divided into the lateral sides of the bladder (SP1), posterior bladder and anterior pelvic organ space (SP2), and posterior uterus (in female subjects) (SP3). The subxiphoid view was excluded as the study was only interested in intraperitoneal free fluid.  

• Outcomes  

Each sub-quadrant of all positive FAST exams was analyzed for the presence of free fluid. 

Results

  • Of the 1,008 FAST scans included in the study, 48 (4.8%) were positive for free fluid. These findings were either confirmed by CT or intraoperatively. 
  • Of the positive FAST exams, 32 (66.7%) were positive in the RUQ, 17 (35.4%) were positive in the LUQ, and 23 (47.9%) were positive in the suprapubic region. 
  • Of the positive RUQ scans, 30 (93.8%) were positive in RUQ3, 27 (84.4%) in RUQ2, and 5 (15.6%) in RUQ1. 
  • Of LUQ scans, 11 (64.7%) were positive in LUQ1, 10 (58.8%) in LUQ2, and 4 (23.5%) in LUQ3. 
  • In the SP view, 15 (64.7%) were positive in SP1, 9 (58.8%) in SP2, and 7/9 (77.7%) in SP3.
  • No correlation was found between quadrants. FAST exam quadrants
  • ruq free fluid

Strength & Limitations

This was a simple, well done study that provides useful information on the FAST exam. The study featured a relatively small sample size of 48 positive FAST exams. There is a potential that in the time between a FAST exam and further intervention (CT or OR) further bleeding could have occurred, thus lowering the sensitivity of the FAST. The authors struggled to make conclusions regarding the suprapubic view between sexes due to a small sample size of positive SP views. 

Authors Conclusion

The caudal tip of the liver (RUQ3) is the most sensitive area for the detection of free fluid on FAST exam.


Our Conclusion

The FAST exam can be an extremely useful tool at the bedside or in the setting of trauma. All areas of the FAST should be properly viewed, with particular emphasis on the caudal tip of the liver. It is important to note that many FAST exams only showed free fluid in one area of one quadrant while showing no free fluid elsewhere, therefore it is important to assess all three areas in every view to increase the sensitivity of the FAST exam. 

The Bottom Line 

Despite previous emphasis on Morrison’s pouch, the caudal liver tip is a more sensitive indicator of intraperitoneal free fluid and should be properly visualized on every FAST exam.

Authors

This post was written by Oliver Marigold, MS4 at UCSD School of Medicine, Charles Murchison MD and Amir Aminlari MD.

References

  1. Von Kuenssberg Jehle, D., Stiller, G. & Wagner, D. Sensitivity in detecting free intraperitoneal fluid with the pelvic views of the FAST exam. The American Journal of Emergency Medicine 21, 476–478 (2003).
  2. AIUM Practice Guideline for the Performance of the Focused Assessment With Sonography for Trauma (FAST) Examination. Journal of Ultrasound in Medicine 33, 2047–2056 (2014).
  3. Lobo, V. et al. Caudal Edge of the Liver in the Right Upper Quadrant (RUQ) View Is the Most Sensitive Area for Free Fluid on the FAST Exam. WestJEM 18, 270–280 (2017).

Can Fluid Accumulation on Ultrasound Diagnose Necrotizing Fasciitis?

necrotizing fasciitis

Background

Necrotizing fasciitis (NF) is rapidly progressing, severe soft tissue infection with a mortality rate of 19.3% with treatment and significantly higher without treatment (1). Early diagnosis is essential to prompt surgical intervention and reduce morbidity and mortality. However, treatment can often be delayed because no laboratory or imaging test can definitively diagnose NF. Contrast-enhanced CT shows the best accuracy, but again is not perfect and can be difficult to obtain in unstable patients. MRI is similarly accurate, but even less feasible in the Emergency Department. Ultimately, it remains a surgical diagnosis.

Ultrasonography is a rapid, bedside, and non-invasive tool that has potential to accelerate assessment of patient with clinical suspicion for NF. There are ultrasonographic findings associated with NF diagnosis, including irregularity or thickening of deep fascia, subcutaneous emphysema, and fluid accumulation along the deep fascial plane (2-13). Considering this condition’s rapid progression, ultrasonography may enable physicians to quickly gauge disease severity and triage accordingly, prompting earlier surgery and bettering patient outcomes.

The Relationship Between Fluid Accumulation in Ultrasonography and Diagnosis and Prognosis of Patients with Necrotizing Fasciitis


Clinical Question

What is the relationship between ultrasonographic finding of fluid accumulation along the deep fascia and diagnosis and prognosis of necrotizing fasciitis?

What ultrasonographic findings are significantly different between NF patients and non-NF patients?

What is the ultrasonographic-detected depth of fluid accumulation along the deep fascia that offers the greatest accuracy to diagnosis of NF?

Is there a difference in the prognosis between NF patients with fluid accumulation compared to NF patients without fluid accumulation? 

Methods & Study Design

• Design 

Retrospective study with prospective enrollment

• Population 

This study was conducted at Chang Gung Memorial Hospital, a suburban academic tertiary care hospital.

Inclusion criteria: patients who visited the ED from February 2015 – November 2016 with clinical suspicion of NF of limbs based on symptoms and clinical signs (severe pain out of proportion, skin findings, rapid progression, crepitus, skin bullae, necrosis, or ecchymosis).

NF group: discharge diagnosis of NF, confirmed by pathology report showing necrosis after surgical intervention

Non-NF group: did not have surgical intervention or whose pathology report did not support NF diagnosis

Exclusion criteria: patients with ED visits between 24:00 – 7:00, non-lesion side also has fluid accumulation, age <18yo, prior antibiotics or debridement, lesions involving trunk area

• Intervention 

Ultrasonographic exam within 1 hour after ED arrival completed by one of three experienced emergency physicians who received an 8-hour basic and soft-tissue ultrasonographic training before the study

Orthopedic consult for surgical opinion

• Outcomes  

  • Diagnostic markers: irregularity or thickening of deep fascia, fluid accumulation, subcutaneous emphysema, subcutaneous cobblestone
  • Reasonable cutoff value of fluid accumulation along deep fascial plane for diagnosing NF according to receiving operating characteristic (ROC) curve
  • Prognostic markers: length of stay (LOS) in hospital, mortality, amputations, number of operations

Results

Ultrasound finding of fluid accumulation and irregular or thickened fascial layer were significantly different between NF and non-NF groups. All patients who had subcutaneous emphysema were in the NF group.

The best cutoff point of fluid accumulation to diagnose NF was 2mm, which had the best accuracy (72.7%), with sensitivity of 75%, a specificity of 70.2%, a positive predictive value of 71.7% and a negative predictive value of 72.7%.

NF patients with fluid accumulation had longer length of stay than NF patients without fluid accumulation (average: 39 days vs. 23 days). Number of operations were not significantly different between NF patients with and without fluid accumulation. All NF patients who had an amputation or died had fluid accumulation.


Overall mortality between NF and non-NF groups showed no significant difference.

Strength & Limitations

Strengths

  • Sample size was larger than other studies investigating ultrasonographic findings for NF diagnosis.
  • Study had a comparator groups with clear definitions (NF vs. non-NF).
  • Ultrasound training was standardized and assessed with inter-rater reliability between three emergency physicians as 100%.

Limitations

  • Small, imbalanced sample of NF patients for sensitivity and specificity analysis of fluid accumulation for amputation and mortality. 
  • Study excluded patients with truncal soft tissue infections.
  • Study excluded patients with prior antibiotics or debridement, which may have been NF patients with higher severity and worse prognosis.
  • Patient population were from south Taiwan exclusively.
  • NF patients had higher prevalence of specific co-morbidities (diabetes mellitus, liver cirrhosis, and alcohol use disorder), which could be confounding. 

Authors Conclusion

“The ultrasonographic finding of fluid accumulation along the deep fascia with a cutoff point of more than 2 mm of depth may aid in diagnosing NF. For the prognosis of NF, when fluid accumulation was present along deep fascia on ultrasound, patients with NF had longer lengths of hospital stays and were at risk of amputation or mortality. Ultrasonography is a point-of-care imaging tool that facilitates the diagnosis and prognosis of NF.” (14)

Our Conclusion

Consistent with prior studies and case reports (2-13), this study supports the role of ultrasound in the diagnosis of NF. Trained emergency physicians were able to successfully use ultrasound to detect significant imaging differences in NF patients, including fascial irregularity and deep fascial fluid accumulation. In comparison to Yen et al., this study suggests an even lower cutoff point of fluid accumulation along the deep fascia (2mm vs 4mm) for the highest diagnostic accuracy. We would caution that the finding of "fluid accumulation" was somewhat difficult to interpret in their study.

Further studies with larger sample sizes need to be completed. However, with the diagnostic and prognostic trends seen in this study, ultrasound should be considered as a timely, efficient imaging modality that can help identify patients with clinical suspicion of NF and accelerate OR intervention.

The Bottom Line 

Ultrasound is a viable imaging modality for patients with clinical suspicion of NF that could potentially expedite surgical intervention, though imaging findings may not be as easy to interpret as the authors lay out.

Authors

This post was written by Caresse Vuong, Charles Murchison MD and Amir Aminlari MD.

References

  1. Khamnuan P, Chongruksut W, Jearwattanakanok K, Patumanond J, Yodluangfun S, Tantraworasin A. Necrotizing fasciitis: Risk factors of mortality. Risk Manag Healthc Policy 2015;8:1–7.
  2. Castleberg E, Jenson N, Am Dinh V. Diagnosis of necrotizing fasciitis with bedside ultrasound: The STAFF exam. West J Emerg Med 2014;15:111–113.
  3. Tsai CC, Lai CS, Yu ML, Chou CK, Lin SD. Early diagnosis of necrotizing fasciitis by utilization of ultrasonography. Kaohsiung J Med Sci 1996;12:235–240.
  4. Wronski M, Slodkowski M, Cebulski W, Karkocha D, Krasnodebski IW. Necrotizing fasciitis: Early sonographic diagnosis. J Clin Ultrasound 2011;39:236–239.
  5. Yen ZS, Wang HP, Ma HM, Chen SC, Chen WJ. Ultrasonographic screening of clinically-suspected necrotizing fasciitis. Acad Emerg Med 2002;9:1448–1451.
  6. Bernardi, Emanuele, Antonello Iacobucci, Letizia Barutta, Elisa Pizzolato, Virna Olocco, and Bruno Tartaglino. “A-Lines in Necrotizing Fasciitis of the Lower Limb.” Journal of Ultrasound in Medicine 33, no. 11 (2014): 2044–46. 
  7. Chao, H. C., M. S. Kong, and T. Y. Lin. “Diagnosis of Necrotizing Fasciitis in Children.” Journal of Ultrasound in Medicine: Official Journal of the American Institute of Ultrasound in Medicine 18, no. 4 (April 1999): 277–81. 
  8. Hosek, William T., and Timothy C. Laeger. “Early Diagnosis of Necrotizing Fasciitis with Soft Tissue Ultrasound.” Academic Emergency Medicine 16, no. 10 (2009): 1033–1033. 
  9. Oelze, Lindsay, Stanley Wu, and Jennifer Carnell. “Emergency Ultrasonography for the Early Diagnosis of Necrotizing Fasciitis: A Case Series from the ED.” The American Journal of Emergency Medicine 31, no. 3 (March 1, 2013): 632.e5-632.e7. 
  10. Kehrl, Thompson. “Point-of-Care Ultrasound Diagnosis of Necrotizing Fasciitis Missed by Computed Tomography and Magnetic Resonance Imaging.” The Journal of Emergency Medicine 47, no. 2 (August 2014): 172–75. 
  11. Shyy, William, Roneesha S. Knight, Ruth Goldstein, Eric D. Isaacs, and Nathan A. Teismann. “Sonographic Findings in Necrotizing Fasciitis.” Journal of Ultrasound in Medicine 35, no. 10 (2016): 2273–77. 
  12. Hanif, Muhammad A., and Michael J. Bradley. “Sonographic Findings of Necrotizing Fasciitis in the Breast.” Journal of Clinical Ultrasound: JCU 36, no. 8 (October 2008): 517–19. 
  13. Valle Alonso, Joaquín, Ganapathiram Lakshmanan, and Yasser Saleem. “Use of POCUS Ultrasound in Sepsis, Bedside Diagnosis of Necrotizing Fasciitis.” QJM: An International Journal of Medicine 110, no. 10 (October 1, 2017): 687–88. 
  14. Lin, Chun-Nan, Cheng-Ting Hsiao, Chia-Peng Chang, Tsung-Yu Huang, Kuang-Yu Hsiao, Yi-Chuan Chen, and Wen-Chih Fann. “The Relationship Between Fluid Accumulation in Ultrasonography and the Diagnosis and Prognosis of Patients with Necrotizing Fasciitis.” Ultrasound in Medicine & Biology 45, no. 7 (2019): 1545–50. 


Bedside Ultrasound Identification of Infectious Flexor Tenosynovitis in the Emergency Department

flexor tenosynovitis

Background

Infectious flexor tenosynovitis (FTS) is a surgical emergency. If not treated promptly, infectious FTS carries significant morbidity including loss of function of fingers, necrosis of the tendon, and even digit amputation (1).

Infection can be caused in three ways: direct inoculation, contiguous spread, or hematogenous spread, as seen in cases of disseminated gonococcal infection. Tenosynovitis occurs when fluid collects between the visceral and parietal layer of the tendon, the most common location being in the hand and wrist.

Traditionally, diagnosis of infectious FTS is centered on the tetrad known as Kanavel’s signs (swelling of the finger, finger held in partially flexed position, pain on palpation of the flexor tendon, and pain on passive extension of the finger). While Kanavel’s signs are specific for infectious FTD, in a study of 41 participants with infectious FTS, only 54% of patients taken to the operating room (OR) had all of these signs (2). The gold standard of diagnosis remains surgical exploration and drainage. MRI can aid in the diagnosis of FTS, but this is rarely available in the ED. While radiographs may be obtained to look for trauma, osteomyelitis or a foreign body, they offer minimal to no additional benefit in diagnosing infectious FTS.   

This article presents a case of a 58-year-old man where point of care ultrasound (POCUS) identified tissue necrosis and fluid along the flexor tendon sheath of the hand, aiding in the rapid diagnosis of FTS, adding to the limited body of literature supporting use of POCUS for early diagnosis of infectious FTS.

Bedside Ultrasound Identification of Infectious Flexor Tenosynovitis in the Emergency Department

Clinical Question

Can point of care ultrasound be used in the emergency department to diagnose infectious FTS?

Methods & Study Design

• Design 

Case report.

• Population 

58 year old male with hypertension, diabetes and end stage renal disease.

• Intervention 

POCUS looking for fluid in flexor tendon sheath. Appropriate technique is shown in the image below, with a linear ultrasound probe placed on the palmar side of the wrist crease. Common findings of FTS are hypoechoic or anechoic fluid surrounding the flexor tendons.

ultrasound flexor tendons
Padrez et al. West J Emerg Med 2015, 16(2)

• Outcomes  

Accurate diagnosis of FTS


Results

The physicians found a moderate amount of fluid and echogenic material within the tendon sheath, as noted in the image below. Orthopedics was consulted and patient was started on broad spectrum antibiotics and taken to the operating room. They found extensive pus within the flexor tendon sheath and cultures grew Staph aureus


ultrasound flexor tenosynovitis
Padrez et al. West J Emerg Med 2015, 16(2)

Strength & Limitations

The POCUS exam the authors describe is practical and useful. This could feasibly be performed by clinicians with relatively little ultrasound training. As mentioned, FTS is a surgical emergency and remains largely a clinical diagnosis, so any modality that helps bring more certainty to the diagnosis, and lead to quicker definitive treatment, is welcome.

It is unclear what the level of ultrasound training was for the physicians who performed this exam. Another note, it may be difficult to distinguish rheumatologic from infectious causes of tenosynovitis using ultrasound, so clinical context is always important. They also mentioned this can only aid in increasing your suspicion for FTS, it cannot be used to rule it out. 

Authors Conclusion

POCUS may be an ideal adjunct for the ED physician in the evaluation of a patient with suspected infectious FTS 

Our Conclusion

We agree with the authors conclusions that POCUS can be a useful adjunct to clinical exam in diagnosing FTS, with the understanding that POCUS cannot rule out FTS or distinguish rheumatologic from infectious process.

The Bottom Line 

POCUS can be a useful adjunct to clinical exam in diagnosing FTS. Use the linear probe and place at the palmar side of the wrist crease, look for hypoechoic or anechoic material around the flexor tendons with possible thickening of the tendon itself. 

Authors

This post was written by Betial Asmerom and Amir Aminlari MD. Edited by Charles Murchison MD.

References

  1. Mamane, W. et al. Infectious flexor hand tenosynovitis: State of knowledge. A study of 120 cases. J. Orthop. 15, 701–706 (2018).
  2.  
  3. Hubbard, D., Joing, S. & Smith, S. W. Pyogenic Flexor Tenosynovitis by Point-of-care Ultrasound in the Emergency Department. Clin. Pract. Cases Emerg. Med. 2, 235–240 (2018).
  4.  
  5. Padrez et al. Bedsound Ultrasound Identification of Infectious Flexor Tenosynovitis in the Emergency Department. West J Emerg 2015. 16 (2). 


Translate »